Showing posts with label Indy. Show all posts

Friday, April 19, 2013

Provincial Tories talking BS on taxes...again.

Well this is pretty rich.  On Wednesday, April 17th Tory backbencher Glen Littlejohn introduced a private members resolution lauding his party for the regressive tax cuts that helped created our fiscal crisis:
"BE IT RESOLVED that this hon. House commends the government for returning half a billion dollars a year to Newfoundlanders and Labradorians by reducing personal income taxes and supports the government in its decision not to increase personal income tax rates to address the Province's fiscal challenge. "
As we explained some time ago, the benefits of these tax cuts were heavily concentrated on the rich, but Littlejohn tries to spin it like all the money went to senior citizens and the poor. You can read it all in Hansard, but the tax relief he describes (using his numbers) is:
  • $30 million increase for Low Income Seniors Benefit,
  • $7 million for Seniors tax credit (my calculation based his information),
  • $42 million home heating rebate,
  • $17 million on a low-income tax deduction (rough calculation based on his numbers).
Add these numbers up and you get less then $100 million dollars. What about the other $400 million that Littlejohn is bragging about? Where did that go? Maybe Jerome Kennedy can enlighten us.

"In 2013, a single individual with taxable income of $50,000 will save over $1,600, or 30 per cent, compared to the amount of taxes they would have paid in 2006 ... So, what we are doing, Mr. Speaker, the tax reductions are benefiting the lower income earners. It is not benefiting the rich – again, whoever the rich may be."

Wow I guess he's right. All the money must go to low income earners, because rich people don't exist.  Next thing those craaazy lefties will have us taxing leprecauns and unicorns.

But hang on, don't provincial cabinet ministers make something like $150,000 a year? Someone earning that much will save about $7,000 a year from the tax cuts.  Sounds like a better deal than $1,600 to me, but what do I know? I'm not a finance minister.

Sunday, March 31, 2013

Call for a review of provincial tax cuts/increases.

Finance Minister Jerome Kennedy has now publicly acknowledged that increasing the HST remains a possibility for future budgets.  Due to the nature of consumer taxes, the HST falls more heavily on low and middle income people than on the wealthy.  A rough analysis of the HST proposal reaches the appalling conclusion that it would leave the majority of tax filers paying more taxes than they would have prior to the election of the PC government while leaving very large tax cuts for the wealthy largely intact.

Thursday, March 28, 2013

Are taxes about to get even more regressive?


A recently published memo written by economist Wade Locke (who was hired by the provincial government to advise them on their "sustainability plan") has recommended a 2% increase in the HST to help raise revenues.  This would boost revenue by about $200 million, and would be a significant contribution to digging us out of the fiscal hole we are in due to the excesses of the Williams government (read more about our current budget challenges here).

Sunday, March 24, 2013

"Right-Sizing" the Public Sector

This post was written by Tom Baird and appeared as a column in The Independent.

Sometime after Muskrat Falls was sanctioned and before a new public sector labour contract is to be negotiated, our provincial government revealed that we are facing an enormous $4 billion deficit over the next three years. On Tuesday the government will release a budget that is expected to include deep spending cuts. Thus begins a new era of austerity in Newfoundland and Labrador. How did this happen?

Saturday, February 23, 2013

Unemployment and urbanization

In a recent column on our housing crisis, I explained that we have big unemployment problem in rural Newfoundland that is causing young adults to move to larger centres.  This got me curious about if this is also true in other provinces or if it is special to NL.

Our Housing Crisis


The opening of my latest column in The Independent.

Thursday, January 24, 2013

Population Growth and Scary Demographics

From my column in the Independent:
Last week the Government of Newfoundland and Labrador announced the hiring of former campaign manager Ross Reid as deputy minister of population growth. Premier Dunderdale says that "our demographic is scary" and we should pursue a population growth strategy to mitigate the effects of our aging population. Time will tell whether this is a serious initiative or simply a patronage appointment as some have alleged. In any case, the issue is a serious one deserving of attention. So how scary are our demographics and how should we deal with the problem?
Read the full article here.

Thursday, January 10, 2013

The Rent Is Too Damn High (in St. John's).

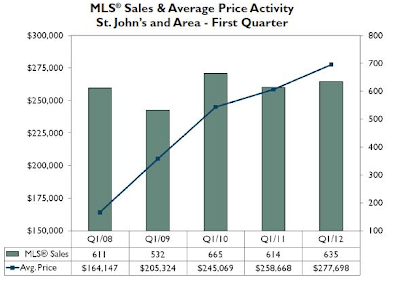
As everyone knows, housing prices in St. John's have been skyrocketing.  Between 2008 and 2012,  house prices rose 69% and rental prices rose 25% in nominal terms.


So what do we make of this?  According to this CBC story, this price surge means "the St. John's market doing almost twice as well as the Canadian average" as though rising prices are clearly a good thing. But while rising housing prices are a boon to the real estate industry and to home owners who are planning to sell their homes and move elsewhere, it is bad news for renters, bad news for people hoping to move to the city, and as I hope to persuade you, bad for the NL economy.  

Saturday, January 5, 2013

Why I Believe in Progressive Taxation

This post has been converted into a article in the Independent.

My recent appearance on NTV news to expose the premier's false statements about our tax system prompted a critical response from a viewer.  The email is a genuine and thoughtful critique of progressive taxation, and expresses a view that I think is widely held (even by some Occupiers).  I reproduce the letter below, followed by a defence of progressive taxation.

"Dear Mr. Baird.  I think you got that statement on NTV backwards.  A higher rate tax on the wealthy is "regressive" not "progressive".  

Wednesday, January 2, 2013

Provincial Taxes Are Still Regressive

In the previous post I made some estimates of the provincial tax burden of individuals according to income level.  I used CRA data for the income tax part, but I was forced to make some assumptions about sales, gas and tobacco taxes.  I think the assumptions were reasonable, but they were only rough guesstimates and not empirically derived.

Since then, I've found a CCPA study that estimates tax incidence for lots of different taxes in Canada.  It's not perfect for my purposes because the data is Canada-wide not Newfoundland specific, but we can try using their numbers as a check that my earlier estimates are reasonable.  

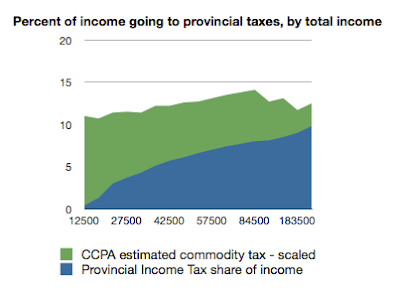
The CCPA lumps together HST, gas, and tobacco into a category they call "commodity taxes". Their estimated tax rate (see table 1) is for the whole country and includes GST. To get something appropriate for Newfoundland I scaled their rate by 0.85.  This factor was chosen to make the total tax collected about equal to revenue in recent budgets.  I end up with the following chart:

The chart is pretty similar to what I had before, except that the share of income going to taxes starts dropping off for income levels over $85K - roughly the richest 5% of tax filers. The textbook reason for this is that the wealthy save a large share of their income and there is no sales tax on money that isn't spent.

Saturday, December 29, 2012

Taxes in NL Are Deeply Regressive

I've added a small followup to this post here.

In a recent interview with NTV, while addressing the provincial budget deficit, Premier Dunderdale stated that

"16% of people in the province pay 70% of the taxes. We need to talk about that."

The premier seems to feel that most Newfoundlanders (i.e. the non-rich ones) do not pay their fair share of taxes. Perhaps she is setting the stage for a regressive tax hike or perhaps she feels that introducing the idea will make cutbacks more palatable and help her with labour negotiations.  In any case, her numbers are bogus and she needs to be called out on it.

I don't know where Dunderdale got her numbers (if anyone knows, please comment), but she is pretty clearly talking about income taxes only, not taxes in general.  According to the latest CRA data, the top 17% of income tax filers paid 67% of provincial income taxes in 2009.  Conflating "income taxes" with "taxes" (a common trick in right-wing American politics: lucky duckies, we are the 53 percent, the Romney video, etc.) is particularly egregious in the NL context where personal income taxes make up only about 13% of government revenue.

Most people pay more in sales tax than income tax, and many spend more on gas and tobacco taxes than income tax, so focussing exclusively on income tax is deeply misleading. Furthermore, top income tax rates were cut in 2010 meaning that even the share of income taxes paid by the rich is less than Dunderdale's figure (probably closer to 60% than 70%).

In the following chart, I've plotted my estimate of the share of income going provincial taxes as a function of total income of individuals. I've had to make a few assumptions that are explained at the end of this post.

People with total income of $10,000 or more pay 10-to-15 percent of their income on these four taxes. The rate grows with income, but only moderately. The top 17% of income tax filers receive 46% of total income and pay about 50% of provincial taxes.   

But this is not the end of the story.  These taxes only account for about 30% of government revenue.  What about the rest?

The government receives about 17% in federal transfers and 7% from corporations.  I'm going to ignore these because I'm interested in taxes on people in Newfoundland.

The biggest revenue source is offshore royalties which account for about 35% of revenue. How one understands ownership of oil revenues is crucial to deciding who is carrying the tax burden in this province.  My position is that the natural resources of our province belong to the people of our province and that they belong to each of us equally.  A poor Newfoundlander has as much claim to our resources as a rich Newfoundlander.   If you'll grant that much, then it stands to reason that the offshore royalties belong to each of us equally, the poor as much as the rich.  Thus we should treat royalties as personal income that is equally distributed and taxed at 100%.

I treat in the same way the much smaller revenues from mining royalties, NLC revenues, lotteries, driver licenses and so on.  This works out to a per capita income of about $5800 a year, of which $5000 comes from oil.  Treating this as personal income that is taxed at 100% results in the following chart.
From this perspective, provincial tax rates are deeply regressive.  The poorest people are paying close to 40% of their income in taxes, the middle class is paying 20-30%, and the rich are paying about 15%.  To use Dunderdale's standard, the richest 17% are only paying about 31% of the total tax burden.

Someone needs to ask Kathy Dunderdale "who owns the natural resources of this province?". If she replies by saying that they belong to the people, then she has no business arguing that the rich are paying more than their share.

******* Note on Calculations *******

Friday, December 21, 2012

Fertility Rates in Newfoundland and Labrador

Update:  The Sir Robert Bond Papers has written a response to this post here.

In 2007, the PC party of NL introduced a $1000 bonus for women who give birth or adopt a baby.  The Sir Robert Bond Papers blog has recently run a series of posts analyzing the effect of this policy on birth rates, concluding that the effect has been small and temporary.   There are a few problems with his analysis though, so I'd like to add to this discussion.

Firstly, his analysis considers only the number of births per year, which fails to account for changes in population and demographics.  A better indicator is the fertility rate: the average number of live births a woman can expect in her lifetime based on age-specific fertility rates in a given year.  Secondly, his analysis doesn't acknowledge that declining birth rates is a trend nation-wide and that provincial rates should be compared to what is happening in other provinces.

The following chart compares NL fertility rates to Canadian fertility rates.  The rates are per 1000 women so a rate of 2000 means that the average woman will have 2 births in her lifetime based on that years stats.
This shows that fertility in NL is consistently below national averages, but has jumped much closer in recent years.  The timing of that jump is easier to see by charting the difference in fertility rates by year.
The jump happened in 2008, the year after the new policy was enacted.  Moreover, the difference has actually narrowed since then.  Now I'm sure that the booming economy has a lot to do with this, but the data is entirely consistent with the PC baby bonus having a significant and enduring effect.

Monday, December 17, 2012

Marijuana Law Enforcement in Newfoundland and Canada

Data from Statistics Canada suggests that police in Newfoundland and Labrador are no longer charging people for simple possession of marijuana.   This contrasts with national data that show simple possession charges rising.

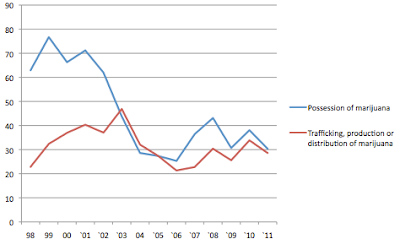
The following charts shows rates of marijuana charges per 100,000 population.  The blue line is charges for possession and the red line is charges for trafficking, production, or distribution.  Since most people charged with a more serious marijuana crime are probably also charged for possession, the gap between the lines gives a measure of charges for simple possession.

Rates of marijuana charges in Canada

Rates of marijuana charges in Newfoundland and Labrador


Since about 2003, charges for possession in NL have barely exceeded those for more serious violations, and fell slightly below in 2003 and 2004.   In contrast, the rates of possession charges in Canada have been growing steadily since 2005 while rates for more serious charges have held steady.  I suspect the fact that Stephen Harper became prime minister in 2006 has something to do with this.

Saturday, October 13, 2012

Public Sector Employment in Canadian Provinces II

I mentioned in the previous post that the larger provinces tend to have smaller percentage of people working in the public sector.  I want to return to that point because I think it is the main reason that NL has a relatively large public sector.  

In the chart below, we compare population to public sector employment in Canadian provinces and territories.  The horizontal axis is public sector employment (excluding federal jobs) as a percentage of population, and the vertical axis is the logarithm of population  (I use a logarithm because population varies by orders of magnitude:  NL is 15 times the size of Yukon and BC is 15 times the size of NL, so just using population would ruin the chart). 

There is a very clear trend: the larger the province or territory, the smaller the share of public sector workers.  The four dots in the top left are the four big provinces: Ontario, Quebec, BC and Alberta.  The three dots to the far right are the territories.  I've marked NL in red.  While it is true that the red dot has been creeping to the right over the last 10 years, it still remains well within the norm.  

Friday, October 12, 2012

Public Sector Employment in Canadian Provinces

A followup to this post can be found here.

This post was inspired by the terrific NL politics blog Labradore.  A few months ago, he posted a chart (reproduced below) showing provincial public sector employment as a share of total employment.

This was meant to demonstrate that the provincial public sector in Newfoundland is unusually large and growing rapidly.  I accepted this conclusion on first reading, but today when I happened upon the post a second time I started to wonder.  Since so many public services go to the elderly (healthcare) and the young (education) who are not normally part of the workforce, isn't it more appropriate to compare public sector employment to the population, rather than to total employment?

So here is what I found.  The following chart shows public sector employment (minus federal general government and federal government business enterprises) as a percentage of population.  Note that the time period is reduced because the data I used only goes back to 2001.

By this measure, it is the prairie provinces Manitoba and Saskatchewan that have historically had the largest public sectors and the large anglophone provinces Alberta, BC and Ontario that have the smallest public sectors. Ten years ago NL was with the rest of the provinces in the middle, but over the last five years we have jumped up to join the prairie provinces.  By this measure, our public sector is big and growing but isn't an outlier.  When compared only to the smaller provinces (those under 3 million people) we have remained somewhere in the middle.

Another reasonable measure is public sector wages as a share of GDP.  Here is the chart.
By this measure the NL public sector dropped from the highest to the second lowest, before climbing back up to the middle of the pack (update:  This is due mostly to the recent economic boom that has driven up GDP.  Public sector wages have actually been rising in real terms).

Together, these charts tell a different story than the one told by Labradore.  The public sector has certainly grown over the last decade, but we have also become wealthier as a province so we can afford to spend more on public services.  If you compare us to the other five provinces with populations under 3 million we seem to be about average.

On the whole, I think it is reasonable to argue that the public sector may be growing too quickly, but it certainly isn't scandalously large by national standards.

Sources: Statistics Canada, CANSIM tables 183-0002, 384-002, 051-0001.

Saturday, July 7, 2012

Oil Royalties and Tax Cuts for the Rich

Since 2006, our provincial government has implemented hundreds of millions of dollars worth of income tax cuts.  Because these tax cuts were funded with oil money and our natural resources belong to the people of the province, it is only right that these tax cuts be shared equally.  Sadly, far more has gone to the wealthy than to the rest of us.

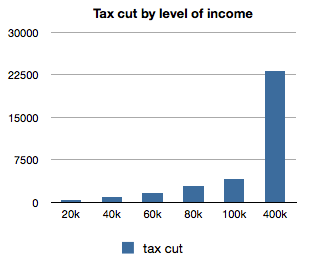
We estimate that a person working full-time at minimum wage (earning about $20k a year) received a tax cut of only $330 per year, and a person earning median full-time income (about $40k) received a tax cut of $930.  Compare this to our MHAs (earning about 100k) who received an annual tax cut of $4,060 and to the wealthiest 1% (average income 400k nationally) who have received tax cuts averaging $23,000 a year.


It is outrageous that the wealth generated from our province's natural resources is being used to fund huge tax breaks for our wealthiest citizens, while providing a mere pittance to the less well-off. Consider the fact that oil royalties contribute about $4,400 per person to government coffers. This means that individuals earning more than $110,000 have gotten more than their share of oil revenues in the form of a tax cut, and that all the increased government spending on debt reduction, infrastructure investment and government services is being paid for by the rest of us.

There are much fairer ways to share the wealth. The state of Alaska distributes natural resource revenue via the Alaska Permanent Fund, which pays regular and equal dividends to all qualifying residents.  Alternatively, we could distribute the wealth through the income tax code by increasing the basic personal income tax credit rather than by cutting tax rates.

We propose that before any future tax code amendment is brought to a vote, that the effect on income inequality be analyzed by the Department of Finance, that their findings be published in a plain language report that is available to the public, and that a summary be read into the public record at the House of Assembly.  The people of this province deserve to be fully informed of how their money is being spent, in terms that are easily understood by the average person.  Real democracy demands nothing less.


Income tax calculations

Older Posts Home