The bad news: they are worse than previously reported.
Here is the updated rate projections sent to me by a Nalcor representative (a member of the Nalcor "social media team").
 |
| Click image to embiggen |
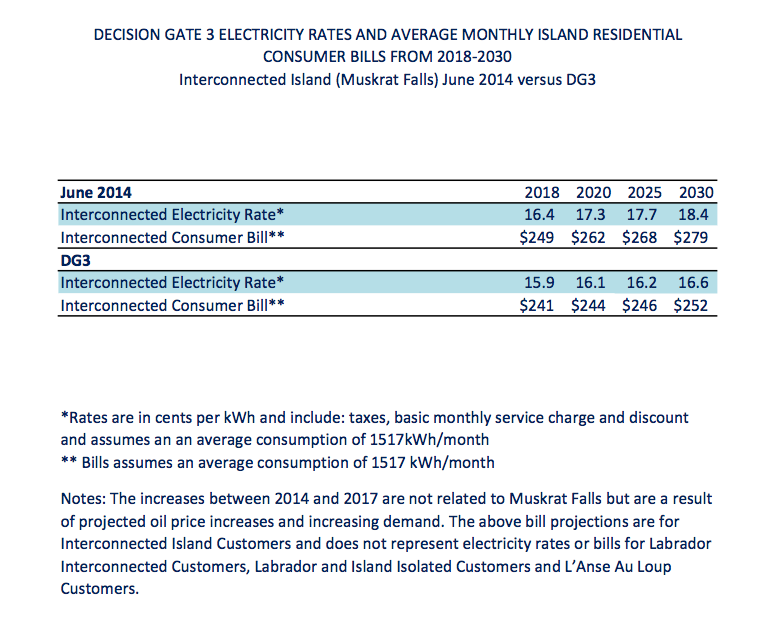
This table shows that the new projections are 0.5 cents higher than DG3 in 2018 and 1.8 cents higher in 2030. This increases the projected average monthly consumer bill by $8 in 2018 rising to $27 in 2030.
Caution is always warranted when comparing dollar values across time. However I believe this comparison is valid for the following reasons. (Update: I have now received confirmation from Nalcor that both projections are in nominal prices and thus are directly comparable. The argument appearing in italics below is no longer important.)
1) In my email to Nalcor (reproduced below) I specifically asked to be provided with updated projections that were directly comparable to the DG3 estimates. The table I was sent is also presented in a way that suggests the numbers are meant to be compared.
2) If we assume that the June 2014 projection is not corrected for inflation but the DG3 figures are, then the table above would say that the new projection is lower in real terms than the DG3 figure, which doesn't make any sense.
3) The table explains the on-first-hearing-nonsensical remarks made by Ed Martin at the press conference when the new cost estimates were released:
"When Muskrat Falls comes into service that's (a monthly power bill increase of) on average about 8 dollar per month to maybe as high as 28 dollars per month - depending on your usage factor - over what was projected at sanction for monthly electricity rates. Once again that depends - the range depends on how much electricity the person uses."
I believe that Martin explained this incorrectly. It does not make sense to offer such a wide range as an average, but it does make sense to say that the average bill increase varies between $8 and $28 over the projected time period. This interpretation is in keeping with Martin's letter to the Telegram which (misleadingly) only offers a direct comparison to DG3 for 2018.
Press reports from the CBC (here and here) only provide the $8 figure and the Telegram report does not include any rate projection so this story has not been properly explained to the public.
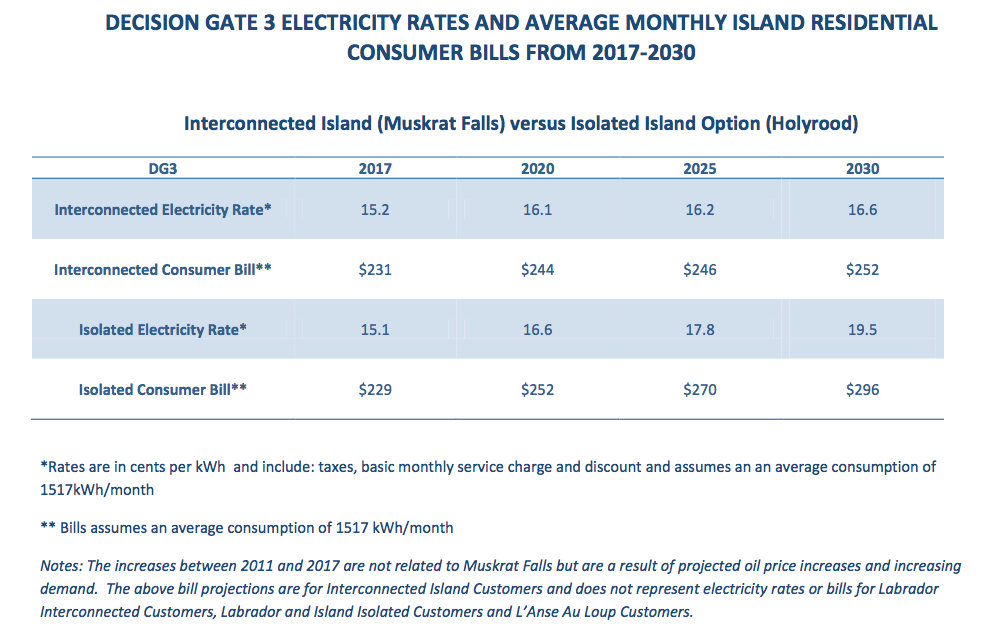
It is interesting to compare the new projections with the DG3 projections for the isolated island option.
 |
| Click image to embiggen |
The DG3 Isolated Electricity Rate is now lower than the new Interconnected Rate until 2025, after which it is higher. Muskrat Falls is no longer a clear winner over this time frame, though it probably remains the cheaper option post-2030.
Email exchange reproduced below:
Sent: July 22
"Hello,
I understand that a response to my earlier question is under preparation. Here is the question for your convenience:
"I understand that Nalcor is estimating that the new cost estimates will
result in a $8 higher monthly power bill for the "average" customer. Iwould like to see the analysis that derived the $8 figure from the new
cost estimates. Is that possible?"
Since posing this question there have been some other public statements from Nalcor that have sown confusion among the public. A good example is Ed Martin's letter to the Telegram that was not careful to explain he is using nominal price estimates. This led to a blog post by Des Sullivan [note: actually written by JM] that has further muddied the waters:
http://unclegnarley.blogspot.ca/2014/07/the-continued-beclouding-of-electricity.html
I think it would be a big help if - in addition to answering the question above - Nalcor released an update of estimated electricity rates in a form directly comparable to this chart:
http://www.powerinourhands.ca/pdf/Electricity_Rates.pdf
thank you,
Tom Baird"
Recieved: July 28
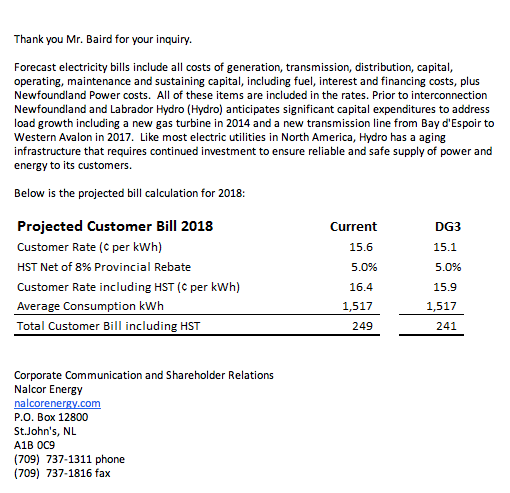
" Thank you Mr. Baird for another question.
As requested, we've updated the Electricity Rates and Average Monthly Island Residential information based on the revised capital cost update for the Muskrat Falls Project that was released in June 2014.
In our reply to your previous question on July 24, 2014, we noted that forecast electricity bills include all costs of generation, transmission, distribution, capital, operating, maintenance and sustaining capital, including fuel, interest and financing costs, plus Newfoundland Power costs. All of these items are included in the projected rates. Prior to interconnection Newfoundland and Labrador Hydro anticipates significant capital expenditures to address load growth including a new gas turbine in 2014 and a new transmission line from Bay d'Espoir to Western Avalon in 2017.
The rate projection information below is from 2018 (year Muskrat Falls Project will be included in island electricity rates) to 2030. The information that was prepared in October 2012 at Decision Gate 3 used 2017 as a starting reference point for Muskrat Falls. The information at Decision Gate 3 also included rate projections for the Isolated Island option. Since the Muskrat Falls Project (Interconnected Island) was sanction in December 2012 there is no longer an Isolated Island option for 2018 and beyond as the system will be interconnected with power from Muskrat Falls.
At the time of the release of the capital cost update for the Muskrat Falls Project at the end of June 2014, Nalcor stated that the change in the electricity rates are expected to be in the range of about 7% to the average homeowner on the island using electric heat. This is for the 10-year period from 2014 to 2023. It is anticipated that when Muskrat Falls is fully operational and our province is powered almost exclusively by renewable energy sources, rates will stabilize for customers, increasing on average around one to two per cent per year.
Attached is the updated chart as requested.
This response will also be posted on the Muskrat Fall Project website shortly.
Regards
(name omitted) "