Saturday, December 29, 2012

Taxes in NL Are Deeply Regressive

I've added a small followup to this post here.

In a recent interview with NTV, while addressing the provincial budget deficit, Premier Dunderdale stated that

"16% of people in the province pay 70% of the taxes. We need to talk about that."

The premier seems to feel that most Newfoundlanders (i.e. the non-rich ones) do not pay their fair share of taxes. Perhaps she is setting the stage for a regressive tax hike or perhaps she feels that introducing the idea will make cutbacks more palatable and help her with labour negotiations.  In any case, her numbers are bogus and she needs to be called out on it.

I don't know where Dunderdale got her numbers (if anyone knows, please comment), but she is pretty clearly talking about income taxes only, not taxes in general.  According to the latest CRA data, the top 17% of income tax filers paid 67% of provincial income taxes in 2009.  Conflating "income taxes" with "taxes" (a common trick in right-wing American politics: lucky duckies, we are the 53 percent, the Romney video, etc.) is particularly egregious in the NL context where personal income taxes make up only about 13% of government revenue.

Most people pay more in sales tax than income tax, and many spend more on gas and tobacco taxes than income tax, so focussing exclusively on income tax is deeply misleading. Furthermore, top income tax rates were cut in 2010 meaning that even the share of income taxes paid by the rich is less than Dunderdale's figure (probably closer to 60% than 70%).

In the following chart, I've plotted my estimate of the share of income going provincial taxes as a function of total income of individuals. I've had to make a few assumptions that are explained at the end of this post.

People with total income of $10,000 or more pay 10-to-15 percent of their income on these four taxes. The rate grows with income, but only moderately. The top 17% of income tax filers receive 46% of total income and pay about 50% of provincial taxes.   

But this is not the end of the story.  These taxes only account for about 30% of government revenue.  What about the rest?

The government receives about 17% in federal transfers and 7% from corporations.  I'm going to ignore these because I'm interested in taxes on people in Newfoundland.

The biggest revenue source is offshore royalties which account for about 35% of revenue. How one understands ownership of oil revenues is crucial to deciding who is carrying the tax burden in this province.  My position is that the natural resources of our province belong to the people of our province and that they belong to each of us equally.  A poor Newfoundlander has as much claim to our resources as a rich Newfoundlander.   If you'll grant that much, then it stands to reason that the offshore royalties belong to each of us equally, the poor as much as the rich.  Thus we should treat royalties as personal income that is equally distributed and taxed at 100%.

I treat in the same way the much smaller revenues from mining royalties, NLC revenues, lotteries, driver licenses and so on.  This works out to a per capita income of about $5800 a year, of which $5000 comes from oil.  Treating this as personal income that is taxed at 100% results in the following chart.
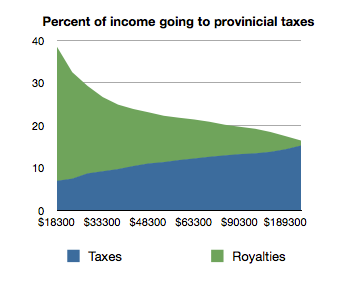
From this perspective, provincial tax rates are deeply regressive.  The poorest people are paying close to 40% of their income in taxes, the middle class is paying 20-30%, and the rich are paying about 15%.  To use Dunderdale's standard, the richest 17% are only paying about 31% of the total tax burden.

Someone needs to ask Kathy Dunderdale "who owns the natural resources of this province?". If she replies by saying that they belong to the people, then she has no business arguing that the rich are paying more than their share.

******* Note on Calculations *******

Friday, December 28, 2012

The Anti-Avalon Bias of Provincial Election Boundaries

According to the Electoral Boundaries Act, section 15(1):  

"the commission shall ensure that the division of the province into districts and the description of the boundaries give primacy to the principle that the vote of every elector in the province shall have a weight equal to that of every other elector."

Let's consider how well this principle is being met by current boundaries. Since the 2006 redistribution there are 4 districts in Labrador, 19.5 on the Avalon, and 24.5 on the island outside of the Avalon (I've split Bellevue in half). The average populations of these districts from the 2011 census are as follows.


Region
Average Population
Labrador districts:
6700
Off-Avalon districts:
9200
Avalon districts:
13450

Avalon districts contain 50% more people than off-Avalon districts and twice as many as Labrador districts. Considered differently, the Avalon would have 5 more seats if the districts were evenly divided.

How did this happen? There are at least three contributing factors: the act requires four districts in Labrador, the boundaries were drawn using 2001 census numbers which don't account for net migration to the Avalon since then, and even based on the outdated 2001 figures the districts in the North-East Avalon were drawn about 15 percent larger than those outside of the Avalon. 

The next redistribution of districts is scheduled for 2016, so unless the act is changed our next election will take place with these lopsided districts that are only getting worse. A change before the election would likely help the NDP, so it probably isn't going to happen.

Instead I'll make a more modest proposal.  Why not postpone the redistribution until 2017 so the commission can use the 2016 census instead of the 2011 census?  It's crazy to draw the boundaries just a few months before the new census data goes public.  The commission might also be permitted to consider population growth projections when setting the boundaries so they don't become outdated as quickly.

*********** Update ************

This chart shows the share of the province's population living in the St. John's census metropolitan area (CMA) versus the share of electoral districts.


Friday, December 21, 2012

Fertility Rates in Newfoundland and Labrador

Update:  The Sir Robert Bond Papers has written a response to this post here.

In 2007, the PC party of NL introduced a $1000 bonus for women who give birth or adopt a baby.  The Sir Robert Bond Papers blog has recently run a series of posts analyzing the effect of this policy on birth rates, concluding that the effect has been small and temporary.   There are a few problems with his analysis though, so I'd like to add to this discussion.

Firstly, his analysis considers only the number of births per year, which fails to account for changes in population and demographics.  A better indicator is the fertility rate: the average number of live births a woman can expect in her lifetime based on age-specific fertility rates in a given year.  Secondly, his analysis doesn't acknowledge that declining birth rates is a trend nation-wide and that provincial rates should be compared to what is happening in other provinces.

The following chart compares NL fertility rates to Canadian fertility rates.  The rates are per 1000 women so a rate of 2000 means that the average woman will have 2 births in her lifetime based on that years stats.
This shows that fertility in NL is consistently below national averages, but has jumped much closer in recent years.  The timing of that jump is easier to see by charting the difference in fertility rates by year.
The jump happened in 2008, the year after the new policy was enacted.  Moreover, the difference has actually narrowed since then.  Now I'm sure that the booming economy has a lot to do with this, but the data is entirely consistent with the PC baby bonus having a significant and enduring effect.

Tuesday, December 18, 2012

Council Meeting Fireworks


The following summary of tonight's St. John's Council meeting was written by Sherwin Flight.  

Here's a basic rundown of what happened today at City Hall.

- At the very beginning, Mayor O'Keefe had everyone in the room stand for a minute of silence for the victims of the recent school shooting in the U.S. He talked about how safety is such an important thing, something we all need to focus on, and how the world just wasn't what it used to be. (More on this later)

Monday, December 17, 2012

Marijuana Law Enforcement in Newfoundland and Canada

Data from Statistics Canada suggests that police in Newfoundland and Labrador are no longer charging people for simple possession of marijuana.   This contrasts with national data that show simple possession charges rising.

The following charts shows rates of marijuana charges per 100,000 population.  The blue line is charges for possession and the red line is charges for trafficking, production, or distribution.  Since most people charged with a more serious marijuana crime are probably also charged for possession, the gap between the lines gives a measure of charges for simple possession.

Rates of marijuana charges in Canada

Rates of marijuana charges in Newfoundland and Labrador


Since about 2003, charges for possession in NL have barely exceeded those for more serious violations, and fell slightly below in 2003 and 2004.   In contrast, the rates of possession charges in Canada have been growing steadily since 2005 while rates for more serious charges have held steady.  I suspect the fact that Stephen Harper became prime minister in 2006 has something to do with this.

Thursday, December 6, 2012

Tax the Rich — An Animated Fairy Tale

Tuesday, December 4, 2012

R.I.P NL Democracy

via People's Assembly NL

Please join us to mark the passing of democracy in Newfoundland and Labrador on December 5, 2012. Visitation hours are from 12-3 PM on the stairs of Confederation Building, where a book of condolences will be available for signing.

NL Democracy was born in 1832. It suffered a near death experience in 1933, was partially resuscitated in 1949, but is set to be executed December 5, 2012.

NL Democracy leaves behind to mourn the people of Newfoundland and Labrador, present and future. In lieu of flowers, please join us for a vigil and memorial service at Confederation Building.

Thursday, November 22, 2012

Just a Game OR The Sheep and the Wolves

     With all the crap going on around the world (Israel decimating Gaza; the ongoing insurrection in Syria; General Strikes across Southern Europe, turning violent when police intervene; Unions in Spain organizing raids on super markets and then distributing the food freely, etc. etc. etc...) it seems a bit surprising that nothing major (that people are noticing and talking about) is happening here in North America (the coming Black Friday events excepted). But then again, the majority of people in Canada and the United States are completely indoctrinated from birth to think that if it isn't affecting them then it doesn't matter. So because of this I end up thinking of the population that they are asleep, as they are not seeing what is going on in the world.
   
    To use a favourite quote of mine: "The Sheep will be slaughtered, or turned to Wolves." Now at first glance it doesn't look good, but let me explain it. I'll break it down into two parts: 'the sheep will be slaughtered,' & 'or turn to wolves.' To understand the first part of the quote two things must be known: Who are the Sheep? & How will they be slaughtered?

    As to who are the sheep? The sheep are the 'sleeping' population that doesn't realize where 'their' politicians are taking them, and doing in their collective name (destroying the ecosystem through allowing systematic exploitation of all our natural resources in the name of 'profit'). Now as to how will they be slaughtered? I just explained part of it.

   What about the second part of the quote: 'or turn to wolves'? what does that mean? Who are wolves?

    Wolves are the people in society who are informed on what is going on and can see what is happening as well. As compared to sheep being 'asleep' wolves are 'awake'. What kind of change can be made in society with people changing to 'wolves'? Any kind of world and society we as humanity want; a more humane society. Where instead of an economy with a focus on profits, we could have an economy where its main goals and focus is to provide for every person's needs.

--Ken

Sunday, November 18, 2012

People's Assembly demos, Nov 18, 2012

Check out some of the images and video from the coordinated demonstrations earlier today. Big thanks to all the people that came out and showed solidarity! Please send us your images/videos to post!

Here's a link to some great pictures from the Rally for Democracy in Happy Valley-Goose Bay, Labrador this afternoon, organized by Friends of the Grand River/Mistashipu and Grand Riverkeepers. Here's their rally handout.

Solidarity with demonstrators in Labrador. More pics here.
More video here.


There was coverage of the People's Assembly St. John's protests of the undemocractic handling of the proposed Muskrat Falls mega-project in the CBC, the Telegram, and even coverage in the Vancouver Sun!


Where's the power? People power!


Special report from Z News and NL's favorite tiny reporter, Zoe. (Thanks Gordon!)

UPDATED YET AGAIN... Photos coming in from friends we met at Confederation Building and another demonstration in solidarity, Boil Up For The Big Land! Solidarity across Newfoundland and Labrador. Keep the pics coming folks


Saturday, November 17, 2012

Political Contributions in Newfoundland and Labrador II

This is the second post in a series. The first can be found here.

Yesterday's post provoked an interesting question on Facebook.   I presented a graph showing that corporate donations go mostly to the party in power and the major recipient party switched from Liberals to PCs when the government changed in 2003.  But did the PCs win the 2003 election because they received more donations, or did they start receiving more donations because they won (or were expected to win)?

First observe that the PCs saw an uptick in donations in 2002, the year before the election.  My guess is that businesses sensed which way the wind was blowing and began hedging their bets by donating to both parties.  Unfortunately, I can't find good polling data from those days to determine at what point a PC victory became likely, so it is tough to make any inference based on expectations at the time.

However here is another test.  If businesses were simply supporting their preferred party in 2003, then you would expect some businesses to donate to the Liberals, some to the PCs, but not very many to support both.  On the other hand, if businesses are trying to curry favour with government, then you would expect most businesses to donate to both parties in order to hedge their bets.

Here is the data.  I've included all companies that donated $10K or more.  Looks to me like most companies are hedging, consistent with the "pay-to-play" hypothesis.


Top Contributors to Provincial Parties in 2003:

           PC
           Lib
Kruger Inc. 10000 28000
North Atlantic Refining Ltd 9000 17000
Inco 11750 14000
A Harvey & Co 10000 12250
Nfld Design Associates 7000 15000
Pennecon 2000 ltd 11000 11000
Aliant Inc. 10000 11400
Abitibi Consolidated 1750 18500
CIBC + CIBC Wood Gundy 5000 15000
BAE Newplan Group Inc. 12000 5000
Husky Energy +Husky Oil 8000 9000
SGE Acres Ltd 10000 6000
BMO bank and Nesbitt Burns 5000 10000
Hatch Associates Ltd. 15000
Reid & Associates 15000
AMEC 9000 5000
Labatt Breweries 4000 10000
Fortis 9250 4400
Island Waste Management 5000 8000
RBC bank + securities 2500 10000
Bristol Group 2000 10000
British Confectionary 4000 8000
Rogers Group 11000 1000
Archean Resources Ltd. 11750
AE Consultants 1500 10000
Woodward's Oil Ltd. 2000 9500
Fishery Products Int. 10000 1400
CHC Helicopter Corp. 10000 1000
NL Consulting Engineers 7000 4000
Insurance Brokers Ass. 10000 800
Barry Group 10000 500
Myles Leger Ltd 7400 3000
Molson Canada 4200 6000
Becktel Canada Ltd 10000
Cougar Engineering and Construction 2000 8000
Imperial Tobacco Canada 5000 5000
J-1 Contracting 10000
Provincial Airlines 10000
Rothmans' Benson & Hedges 10000
Scotiabank 2000 8000

Friday, November 16, 2012

Political Contributions in Newfoundland and Labrador

I've added a followup to this post here.

The recent $500 a plate fundraiser for the provincial PC party got me wondering about who contributes money to the provincial political parties. Here is what I got from Elections NL. 

Two things jump out right away:  most donations go to the governing party and most donations come from businesses.  The following chart presents total income of the provincial political parties over the last 8 even years (only `96 was an election year).


Can you tell in what year the PCs were elected?  It is the year where the blue and red lines cross.  In 2010, the PC party received income of $820,000 compared to $101,000 for the Liberals.  In 1998, the Liberals received $975,000 compared to $67,000 for the PCs.    The NDP has been stuck around $75,000 the entire time. 

Where is the money coming from?  In 2010, over 80% was from corporate donations.  I've classified corporate donors giving more than $2000 according to industry and listed them below in rounded figures.  The first column is donations to the PC party and the second is donations the Liberal party (there are none to the NDP).  The discrepancy is hard to miss.


Construction and Contracting:

Pennecon Ltd 14000 1000
BAE - Newplan Grounp Ltd. 14500
DF Barnes Ltd 14000
NL Design Associates Ltd 12000 250
AMEC Americas Ltd. 9500
Provincial Paving Ltd 7500
J-1 Contracting Ltd 5000
Municipal Construction Ltd 5000
Fortis 4500
ND Dobbin Ltd 3900
Nortech Construction Ltd 3900
Ellsworth Estates Inc 3800
Crosbie Group Ltd 3400
Marco Services Ltd 2500
Eastern Contracting Ltd 3600


Total                                              $107K            $1K


Architecture:

PHB Group Inc. 13000
Gibbon Snow Architects Inc 11000
Sheppard Case Architects Inc. 10000
Hearn Fougere Architects Inc 8200
Frank Stanley & Associates, Architect 6450
John Hearn Architect Inc 5000
Ron Fougerie Associates Ltd 5000
Hampton Architects Inc 4000 100


Total                                              $63K           $0.1K


Engineering:

Hatch Mott MacDonald Ltd 8000
NL Consulting Engineers Ltd 7500
GJ Cahill & Co 5700
Core Engineering Inc. 4800 500
Quadratec Inc. 5000
Design Management Group Ltd 3800
AMEC Earth & Enviro 3500
CBCL Ltd 2300 500
NewLab Engineering Ltd 2300 450
Exploits Engineering Consultants Ltd 2400
Crosbie Engineering 2100

Total                                               $47K            $1K


Telecomm:

Bell Aliant Inc. 16000 5500
Rogers Comm. Inc. 9500 4500


Total                                               $26K         $10K


Mining/Oil:

Vale/ Vale Inco 9000
Coordinates Capital Corp 5000
Aurora Energy 3400 1500
Fugro Jacques GeoSurveys Inc. 5350
North Atlantic Refining Ltd 4500
Imperial Oil Ltd 2400


Total                                               $30K        $1.5K

Financial:

Citicorp Finance 5100
Bank of Nova Scotia 5000
TD Financial Group 4500
Royal Bank of Canada 2800
CIBC Wood Gundy 6500


Total                                              $19K            $5K


Retail:

Shoppers Drug Mart 8500
British Confectionary Company Ltd 8000
Coleman Management Services Ltd. 5000
JB Hand & Sons Ltd 3000
Chester Dawe Ltd. 2500
Canadian Tire 2250


Total                                               $29K


Beverage Manufacturers:


Labatt Brewing Company 9000
Browning Harvey Ltd 6500 700
Molson Coors Brewing Company 7000

Total                                               $23K             $1K


Marketing/Public Relations:

The Idea Factory 4500
M5 Marketing Communications Inc. 4300
Pilot Communications Inc 2800
Market InsightsInc 2500
Promoworks Inc. 2500


Total                                               $16K


Shipping:

PF Collins Customs Broker Ltd 7000
Oceanex Inc 5500
Puddister Shipping Ltd 2300


Total                                               $15K


Law firms:

Fasken Martineau Duomulin SEN 9500
Benson Myles PLC Inc. 5150


Total                                               $15K


Fisheries:

Ocean Choice Int Inc 6500
Labrador Fisherman's Union Shrimp Company 1000 1200

Total                                                $8K             $1K


Pulp and Paper:

Kruger Inc 4500
Corner Brook Pulp and Paper Inc 2000


Total                                                $7K


There are a handful of donations that didn't fit into these categories.  Provincial Airlines, who are currently implicated in the Penashue scandal, gave $17.5K to the PCs and five hundred to the Liberals.   Labrador Marine Inc., who operate ferry service in Labrador, gave $10K to the PCs.  A Harvey & Company, a diversified group of companies, gave $10K to the PCs.  There are single donations from a hotel, an aquaculture company,  a sheet metal manufacturer, and a real estate company.   A marketing firm called Bristol Group Inc. gave a huge donation of $38K to the Liberals right before getting taken over by a competitor, which seems pretty weird so I didn't include it in the table above.

In addition to corporate donations, there were a couple individual donations to the PCs and the United Steel Workers of America gave $20K to the NDP.   The second biggest donation to the NDP?  Lorraine Michael, who contributed $1200.

So what is behind all this generosity?  The biggest donors are competing for construction contracts: construction, architecture and engineering.   The natural resource companies are always dealing with government.  Law and PR get government business. I'm not sure about retail, finance, telecoms, and beer; I guess they just have a lot of money to splash around.

The fact that corporate contributions are going overwhelmingly to the governing party strongly suggests a "pay to play" culture:  businesses feel they need to pay up in order to win government contracts and other favours.  Politicians will deny that they are affected by donations, but reciprocity is such a fundamental part of human nature that all this money must be distorting their behaviour.  Corporate political contributions are bad for democracy and we should fight to put an end to them.

*********
PS:  If you like this kind of stuff you should check out Labradore which has several recent posts on this subject, including an analysis of election year donations to individual candidates.

Tuesday, November 13, 2012

NL Mulls BYOB Policy for Restaurants


Diners in this province might soon be able to bring their own bottle of wine to restaurants. The Newfoundland and Labrador Liquor Corporation (NLC) has put forward a recommendation to change the liquor laws. Now it is up to the Department of Finance to make the final decision.
Doesn’t this seem like a no-brainer? Surely, more choice for patrons is a good thing. Not according to the Restaurant Association. Here’s what they claim:
  • BYOB is bad for business because profit margins are tight (3 per cent), especially at high end restaurants.
  • If BYOB was an option 80 per cent of restaurants would offer it and the other 20 per cent would suffer.

Wednesday, November 7, 2012

Time for the People to get involved.

The Muskrat falls process so far has been anything but satisfactory to most people. Undemocratic, to say the least—the latest coming yesterday, when the government announced that there wouldn't even be a debate in the House of Assembly on Muskrat Falls. Reclaim the political process by joining the newest initiative for direct democracy in this province. 

Attend the People's Assembly Undemocracy Tour Nov 19th 1 PM
on the steps of Confederation Building!
The People’s Assembly is a grassroots forum for direct democracy. It is an alternative to an unresponsive system of top-down party politics. The People of Newfoundland and Labrador have the right to actively participate in the political process and the civic responsibility to ensure this happens.

To this end, the People’s Assembly is holding a weeklong Referendum on Muskrat Falls, running November 18th through 25th. On Sunday, November 18th there will be a public demonstration to kick off the referendum, meeting at Harbourside Park in downtown St. John's at 12:00 noon and marching to Colonial Building for a rally. Throughout the week there will also be daily marches and other actions in order to bring the political process back to the People. Regardless of differences on the merits of the Muskrat Falls project, few can be satisfied with the process as it has unfolded. Participating in the referendum is a way to take part in this political decision, but also to show your dissatisfaction with a broken political system. This "do-it-ourselves" approach demonstrates a new set of expectations to a government that will not simply change on its own.

Check out the pa-nl.ca website for updates. Let the people be heard. Get involved!

Monday, November 5, 2012

Rethink Muskrat Falls protest — Nov 5, 2012

Concerned citizens gathered at Confederation Building this morning to urge people to rethink the Muskrat Falls project. Members of the group Friends of the Grand River/Mistashipu, along with supporters from various parts of the province, came out to make their voices heard! This is only the beginning. Solidarity!

Check out blogposts on other recent protests in Labrador here and here.

Note the upside down flags indicating distress


Protesters took their message to the roadside.
Lots of cars honked to show their support!
A small but lively group – sure to grow.


Solidarity.

Tuesday, October 30, 2012

Muskrat Falls direct action planning

** UPDATE: Nov 5th —We will be continuing our organizing at the GA tonight as well. 7 pm. Harbourside Park. Join us!

We will be discussing direct action on Muskrat Falls at our General Assembly tonight (Tues Oct. 30) at Harbourside Park at 7 PM. This is not about pro or con Muskrat Falls. This is about political process and civic engagement.

We are calling for an NL People's Assembly on principles of direct democracy to address shortcomings of a top-down political system.

Now is the time to reclaim the power of the people. Rise up NL!
---

Check out some of the other Muskrat actions in Labrador.


Thursday, October 25, 2012

Canada-China Investment Treaty (#FIPPA) Information Round-up

The Canada-China FIPPA (Foreign Investment Promotion and Protection Act) was quietly tabled in the House of Commons on September 26th. This was the first time anyone got a chance to see the full text of an agreement that will be automatically ratified after 21 sitting days without any parliamentary debate or vote. 

Check out this great new website: FIPA FACTS.

FIPPA will bind municipal, provincial and federal government for the next 15 years to terms that have been shown to favour Chinese investors rights in ways that infringe on Canadian sovereignty and democracy. Even if a future government wanted to cancel the treaty, a one-year notice is required, and then after the cancellation the treaty guarantees another 15 years of treaty benefits to Chinese operations in Canada. 

Sunday, October 21, 2012

The 4 O'Clock Whistle—Call for Submissions for 5th issue!

The 4 O'clock Whistle, The Bay of Islands Free and Independent Magazine is currently looking for submissions for the 5th issue of their publication from members of the student/worker community of Newfoundland and Labrador, Atlantic Canada, and beyond.

Check out issues #1 and 2! And the latest issue here!

Submissions could include writing, art, and journalism (but are certainly not limited to these mediums). All articles and artwork submitted would be published under a creative commons copyright and would be distributed free of charge to locations around The Bay of Islands. (A note: They will do their best to publish submissions, though please be advised that they do not publish pieces that are racist, sexist, LGTBAQ phobic, or that promote hatred towards groups of people or individuals, and what they choose to publish remains at their discretion).

The 4 O'Clock Whistle accepts work written under pseudonyms and will do their best to protect the identities of authors who wish to remain anonymous.

The deadline for submissions to the 5th Issue is November 30, 2012.

To submit work email them at: [email protected]

For more information check them out on Twitter:
@4oclockwhistle (https://twitter.com/4oclockwhistle)

And Facebook:
https://www.facebook.com/The4OClockWhistle

Saturday, October 13, 2012

Public Sector Employment in Canadian Provinces II

I mentioned in the previous post that the larger provinces tend to have smaller percentage of people working in the public sector.  I want to return to that point because I think it is the main reason that NL has a relatively large public sector.  

In the chart below, we compare population to public sector employment in Canadian provinces and territories.  The horizontal axis is public sector employment (excluding federal jobs) as a percentage of population, and the vertical axis is the logarithm of population  (I use a logarithm because population varies by orders of magnitude:  NL is 15 times the size of Yukon and BC is 15 times the size of NL, so just using population would ruin the chart). 

There is a very clear trend: the larger the province or territory, the smaller the share of public sector workers.  The four dots in the top left are the four big provinces: Ontario, Quebec, BC and Alberta.  The three dots to the far right are the territories.  I've marked NL in red.  While it is true that the red dot has been creeping to the right over the last 10 years, it still remains well within the norm.  

Friday, October 12, 2012

Public Sector Employment in Canadian Provinces

A followup to this post can be found here.

This post was inspired by the terrific NL politics blog Labradore.  A few months ago, he posted a chart (reproduced below) showing provincial public sector employment as a share of total employment.

This was meant to demonstrate that the provincial public sector in Newfoundland is unusually large and growing rapidly.  I accepted this conclusion on first reading, but today when I happened upon the post a second time I started to wonder.  Since so many public services go to the elderly (healthcare) and the young (education) who are not normally part of the workforce, isn't it more appropriate to compare public sector employment to the population, rather than to total employment?

So here is what I found.  The following chart shows public sector employment (minus federal general government and federal government business enterprises) as a percentage of population.  Note that the time period is reduced because the data I used only goes back to 2001.

By this measure, it is the prairie provinces Manitoba and Saskatchewan that have historically had the largest public sectors and the large anglophone provinces Alberta, BC and Ontario that have the smallest public sectors. Ten years ago NL was with the rest of the provinces in the middle, but over the last five years we have jumped up to join the prairie provinces.  By this measure, our public sector is big and growing but isn't an outlier.  When compared only to the smaller provinces (those under 3 million people) we have remained somewhere in the middle.

Another reasonable measure is public sector wages as a share of GDP.  Here is the chart.
By this measure the NL public sector dropped from the highest to the second lowest, before climbing back up to the middle of the pack (update:  This is due mostly to the recent economic boom that has driven up GDP.  Public sector wages have actually been rising in real terms).

Together, these charts tell a different story than the one told by Labradore.  The public sector has certainly grown over the last decade, but we have also become wealthier as a province so we can afford to spend more on public services.  If you compare us to the other five provinces with populations under 3 million we seem to be about average.

On the whole, I think it is reasonable to argue that the public sector may be growing too quickly, but it certainly isn't scandalously large by national standards.

Sources: Statistics Canada, CANSIM tables 183-0002, 384-002, 051-0001.
Newer Posts Older Posts Home