
Since then, I've found a CCPA study that estimates tax incidence for lots of different taxes in Canada. It's not perfect for my purposes because the data is Canada-wide not Newfoundland specific, but we can try using their numbers as a check that my earlier estimates are reasonable.
The CCPA lumps together HST, gas, and tobacco into a category they call "commodity taxes". Their estimated tax rate (see table 1) is for the whole country and includes GST. To get something appropriate for Newfoundland I scaled their rate by 0.85. This factor was chosen to make the total tax collected about equal to revenue in recent budgets. I end up with the following chart:
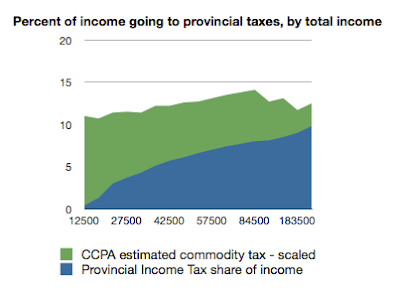
The chart is pretty similar to what I had before, except that the share of income going to taxes starts dropping off for income levels over $85K - roughly the richest 5% of tax filers. The textbook reason for this is that the wealthy save a large share of their income and there is no sales tax on money that isn't spent.
No comments:
Post a Comment